Fuhad Abdulla
Preview Video Below
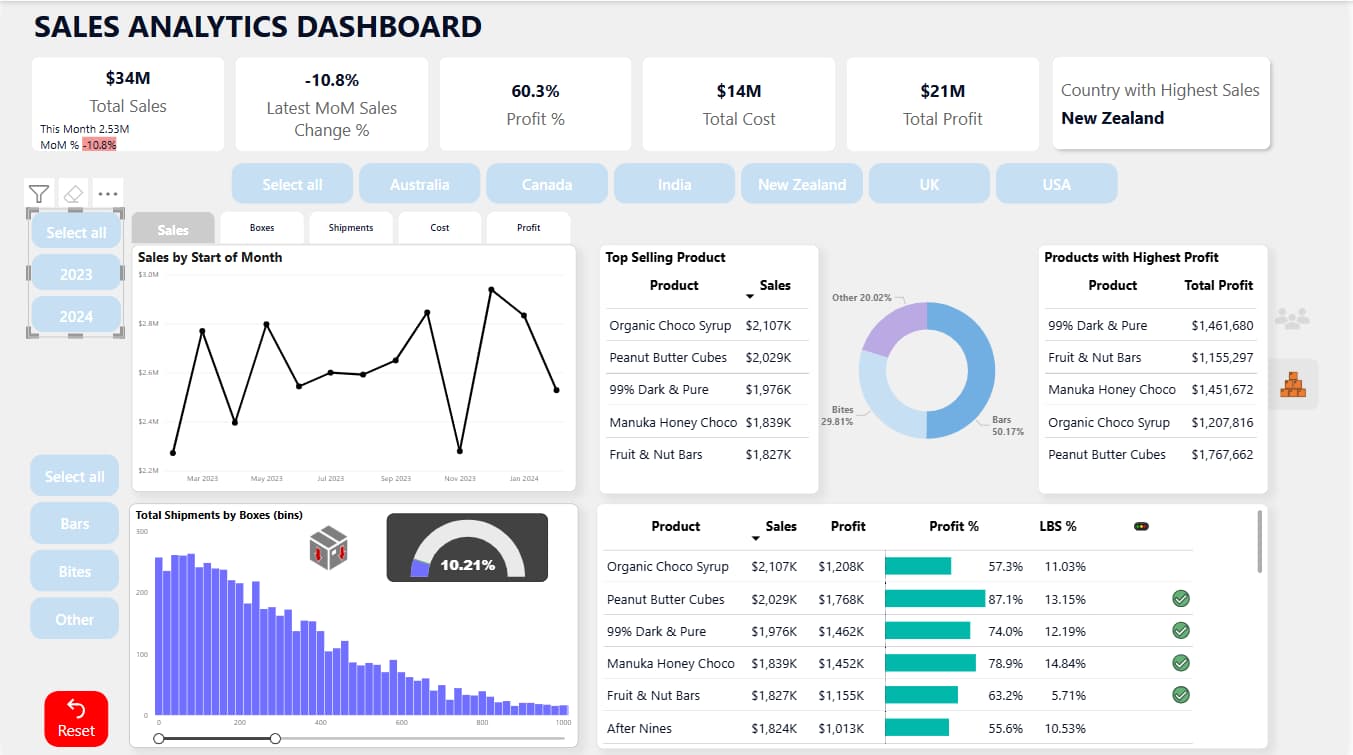
Features
- Measure Selector for dynamic analysis
- Conditional Formatting for better data visualization
- Bookmarks for seamless navigation
- Complex DAX Measures to generate insightful visuals
- Reset Button to clear filters easily
- Tooltips for quick insights
- Profitability Analysis to identify high-profit areas
Key Insights & Recommendations
How can we apply these insights to other markets?
- Top Improved Salespersons: Ches Bonnell & Gunar
What factors contributed to their improvement?
Were they newly hired?
How can we sustain their performance and motivate them further?
- Top 5 Salespersons: Kelci Walkedn, Rafaelite Blaksland, Husein
Consider offering incentives to maintain motivation.
Leverage their expertise—train other sales team members.
- Top Selling Products: Organic Choco Syrup & Peanut Butter Cubes
Can we bundle these with lower-performing products to boost overall sales?
- Most Profitable Products: 99% Dark & Pur, Fruit & Nuts Bar
Can we introduce a new product line with similar ingredients?
Should we invest more in marketing these products to maximize sales?
99% Dark & Pur has the highest profit margin but ranks third in sales—how can we boost its sales further?
- Sales Decline: 25.3% Drop in Canada
Identify the root cause:
Were discounts discontinued?
Did a major retailer stop carrying our products?
- Sales Growth: Notable Increase in India & New Zealand
What strategies worked here that didn’t elsewhere?
Should we replicate these strategies in other regions?
Is marketing the key driver?
- Bars Among Top-Selling Products
What strategies made bars successful?
Can we apply these strategies to boost sales of Bites?
Should we focus more on our core product line (Bars)?
- India’s Market Success: 3 of the Top 5 Selling Products Are from India
What factors contribute to their strong performance?
Measures Created
- Total Sales
- Total Boxes
- Total Shipments
- Total Costs
- Total Profit
- Profit %
- LBS Counts
- LBS %
- MoM Change for
- Boxes Change %
- Costs Change %
- Profit Change %
- Sales Change %
- Shipments Change %
- YoY Change for
- Boxes Change %
- Costs Change %
- Profit Change %
- Sales Change %
- Shipments Change %
Explanation of DAX
Total Cost = SUM(shipments[Costs])

This sums up all the rows of costs column in shipment table
MoM Sales Change % =
var this_month= [Total Sales]
var prev_month= [Total Sales (prev month)]
return
DIVIDE(this_month-prev_month,prev_month)
# In this dax we are calculating Month on Month Change
# Here we are defining two variables and then using that variable to calculate the changeMoM Boxes Change % =
var this_month= [Total Boxes]
var prev_month= CALCULATE([Total Boxes],PREVIOUSMONTH('calendar'[Date]))
return
DIVIDE(this_month-prev_month,prev_month)
# This is similar to above but we are calculate the previous month total boxesLatest Date= LASTDATE('calendar'[Start of Month])
# Get Last Date of the Total Sales Latest Month =
var ld =[Latest Date]
return
CALCULATE([Total Sales],'calendar'[Start of Month]=ld)
# Here CALCULATE function filter the total sales to include the row whichs start of month matched the Latest Date
# Latest Date measure is calculated like this
# Latest Date = LASTDATE('calendar'[Start of Month])Latest MoM Sales Change % =
var ld = [Latest Date]
var this_month_sales =[Total Sales Latest Month]
var previous_month_sales=CALCULATE([Total Sales],'calendar'[Start of Month]=EDATE(ld,-1))
return
DIVIDE(this_month_sales-previous_month_sales,previous_month_sales)
# Here we have new learning EDATE which is used to calculate dateProfit Target Indicator = IF([Profit %]>[Profit Target],2,IF([Profit %]>0.9*[Profit Target],1,0))
# To create If conditional to check whether the sales people have achieved the target