Fuhad Abdulla
Implementing AI in Finance: Ideas
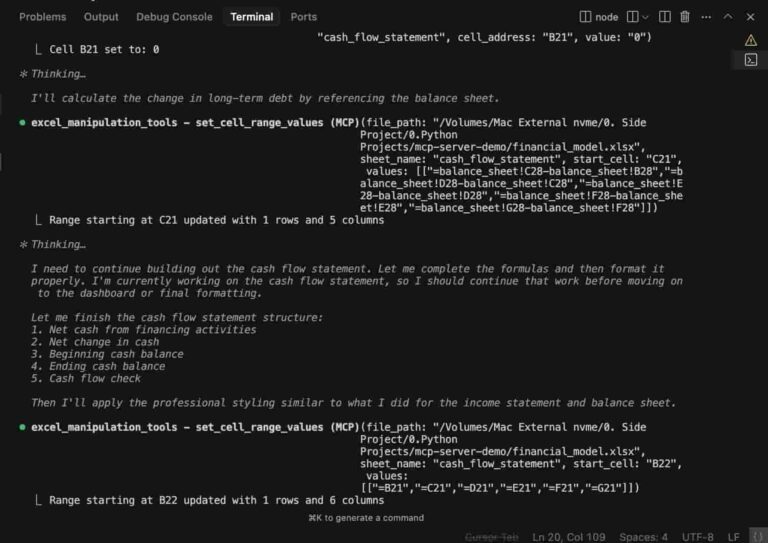
Just vibe-coded a Financial Modeling Excel AI Agent with Claude Code (for fun… but it actually works) The Excel file in the screenshot? 100% built by AI from a single prompt. It created the file, read it, and modified it,…
I’m a Chartered Accountant (ACCA) working as a Financial Data Analyst who knows how to use AI. All built using AI, without writing a single line of code. I gave the instructions, and AI did the rest. During a chat…
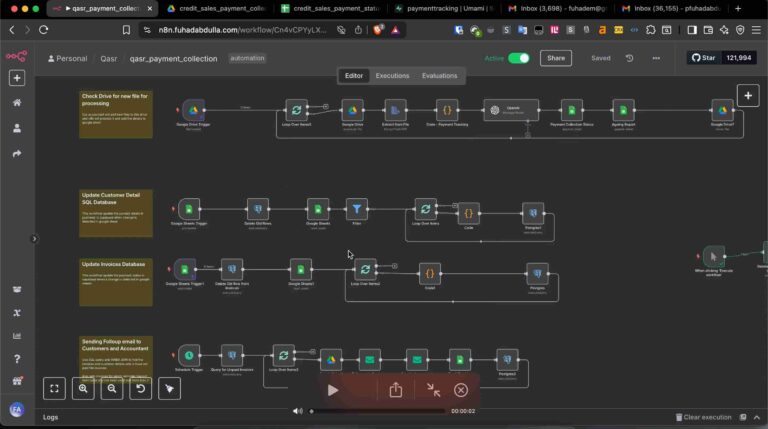
𝗜 𝗔𝘂𝘁𝗼𝗺𝗮𝘁𝗲𝗱 𝗔𝗰𝗰𝗼𝘂𝗻𝘁𝘀 𝗥𝗲𝗰𝗲𝗶𝘃𝗮𝗯𝗹𝗲 (𝗔𝗥) 𝗽𝗿𝗼𝗰𝗲𝘀𝘀, 𝗶𝗻𝗰𝗹𝘂𝗱𝗶𝗻𝗴 𝗳𝗼𝗹𝗹𝗼𝘄-𝘂𝗽𝘀 𝗮𝗻𝗱 𝗮𝗴𝗲𝗶𝗻𝗴 𝗿𝗲𝗽𝗼𝗿𝘁 𝗴𝗲𝗻𝗲𝗿𝗮𝘁𝗶𝗼𝗻, 𝘂𝘀𝗶𝗻𝗴 𝗔𝗜 𝗮𝗻𝗱 𝗻𝟴𝗻 𝗮𝘁 𝗼𝘂𝗿 𝗰𝗼𝗺𝗽𝗮𝗻𝘆. 𝘕𝘰𝘵𝘦: 𝘛𝘩𝘦 𝘷𝘪𝘥𝘦𝘰 𝘩𝘢𝘴 𝘢𝘶𝘥𝘪𝘰—𝘮𝘢𝘬𝘦 𝘴𝘶𝘳𝘦 𝘵𝘰 𝘶𝘯𝘮𝘶𝘵𝘦 𝘪𝘵 𝘪𝘧 𝘺𝘰𝘶’𝘥 𝘭𝘪𝘬𝘦 𝘵𝘰 𝘩𝘦𝘢𝘳 𝘮𝘦 𝘦𝘹𝘱𝘭𝘢𝘪𝘯 𝘵𝘩𝘦 𝘱𝘳𝘰𝘤𝘦𝘴𝘴. We are a…
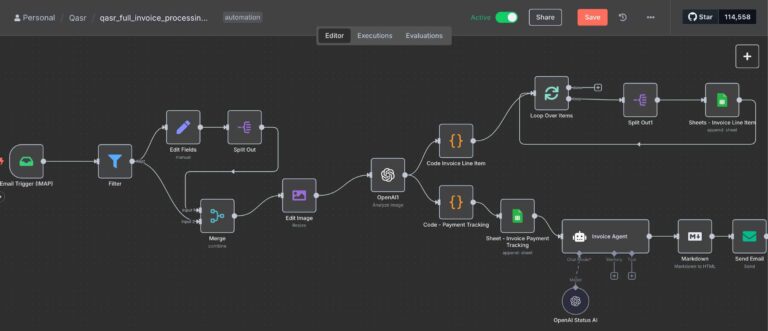
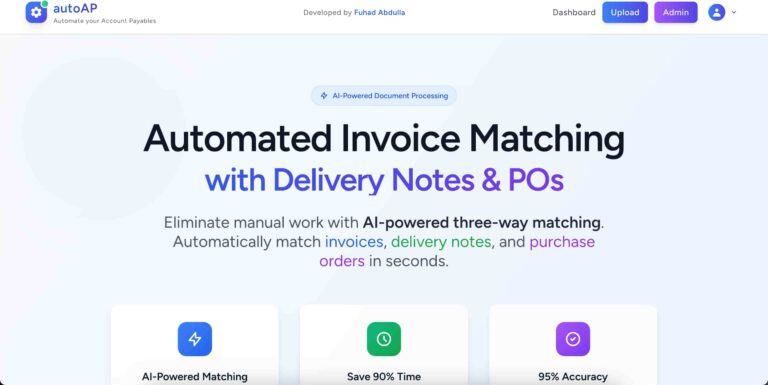
Processing and tracking purchase invoices has always been time-consuming at our company—especially since most invoices are received manually and payment tracking is difficult to maintain. To solve this, I implemented a fully automated invoice processing workflow using AI Agent and…
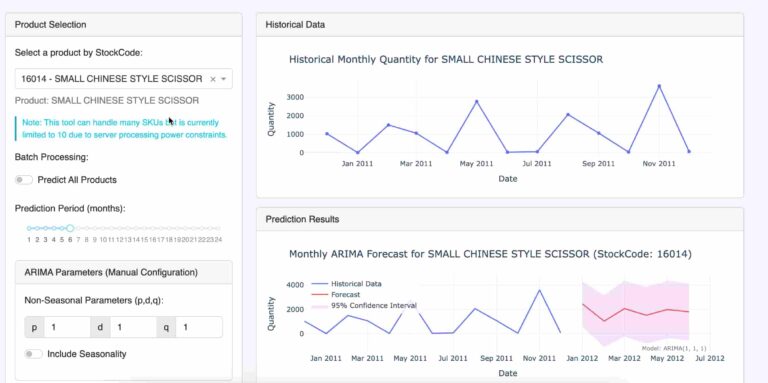
I developed a Web App Leveraging Machine Learning to Forecast Multi-SKU Product Demand Managing stock across thousands of SKUs is no joke — especially when dead stock eats into your margins and stockouts kill your customer experience. Predicting product demand…
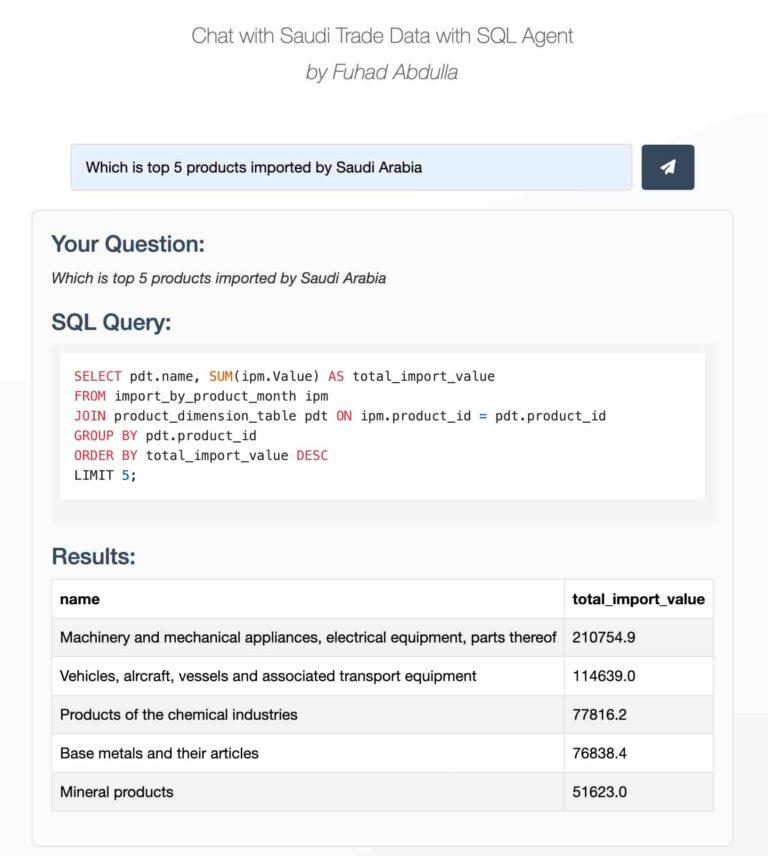
Can we chat with SQL databases using Natural Language instead of writing complex queries? 🤖💬 🚀 Tech Stack: As a Data Analyst, staying updated with the latest technology is crucial. 🔍📈 I recently came across a video where Uber leveraged…
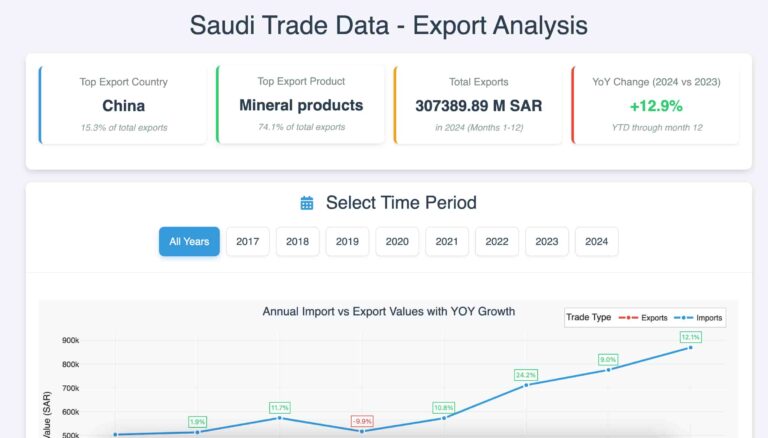
🌍📊 End-to-End Saudi Arabia International Trade Data Analysis ( Import / Export Analysis ) Proud to share my latest project: A fully interactive dashboard analyzing Saudi Arabia’s import & export data! 🎯 🔗 Check it out here 👉 sauditrade.fuhadabdulla.com 🛠…
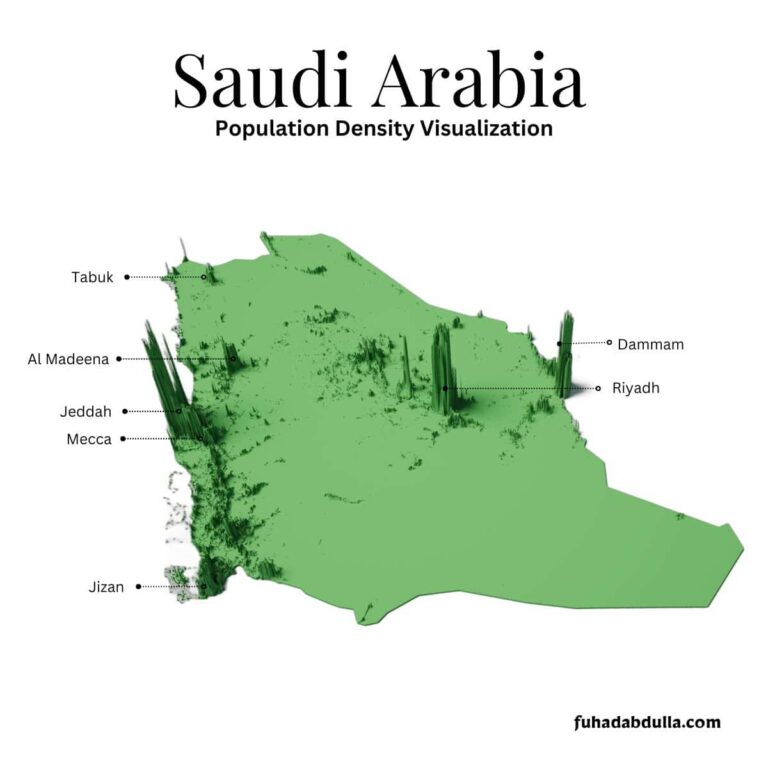
Visualizing Population Density Data Across Saudi Arabia 🇸🇦 Looking at and analyzing a country’s population density is fascinating, as it reveals where people are concentrated, highlights the significance of different regions, and helps assess land availability for infrastructure and development.…
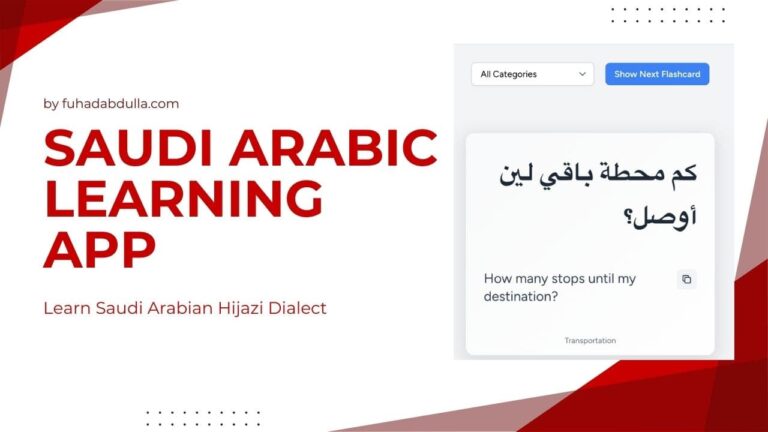
Living and working in Saudi Arabia, I realized how important it is to learn Arabic—especially the local Hijazi dialect spoken in Jeddah. However, finding resources to learn this dialect wasn’t easy. After taking a course to grasp the basics, I…