Fuhad Abdulla
Visualizing Population Density Data Across Saudi Arabia 🇸🇦
Looking at and analyzing a country’s population density is fascinating, as it reveals where people are concentrated, highlights the significance of different regions, and helps assess land availability for infrastructure and development.
Using advanced geospatial tools, I visualized Saudi Arabia’s population density data with two datasets and different tech stacks:
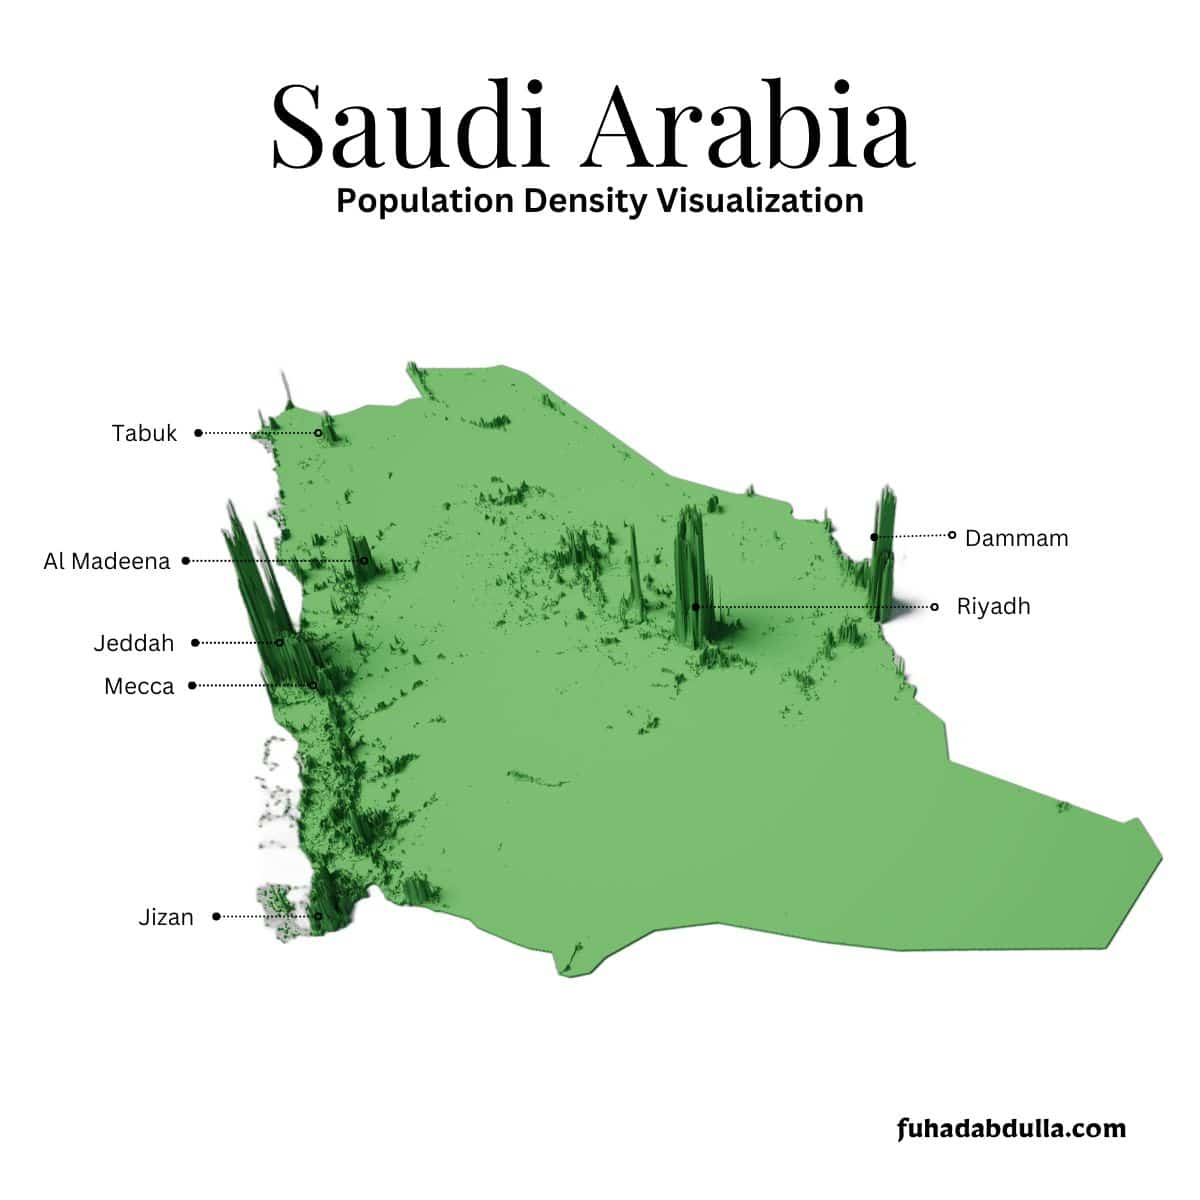
📌 Image 1:
🔹 Dataset: WorldPop Population Dataset
🔹 Tools: QGIS + Aerialod
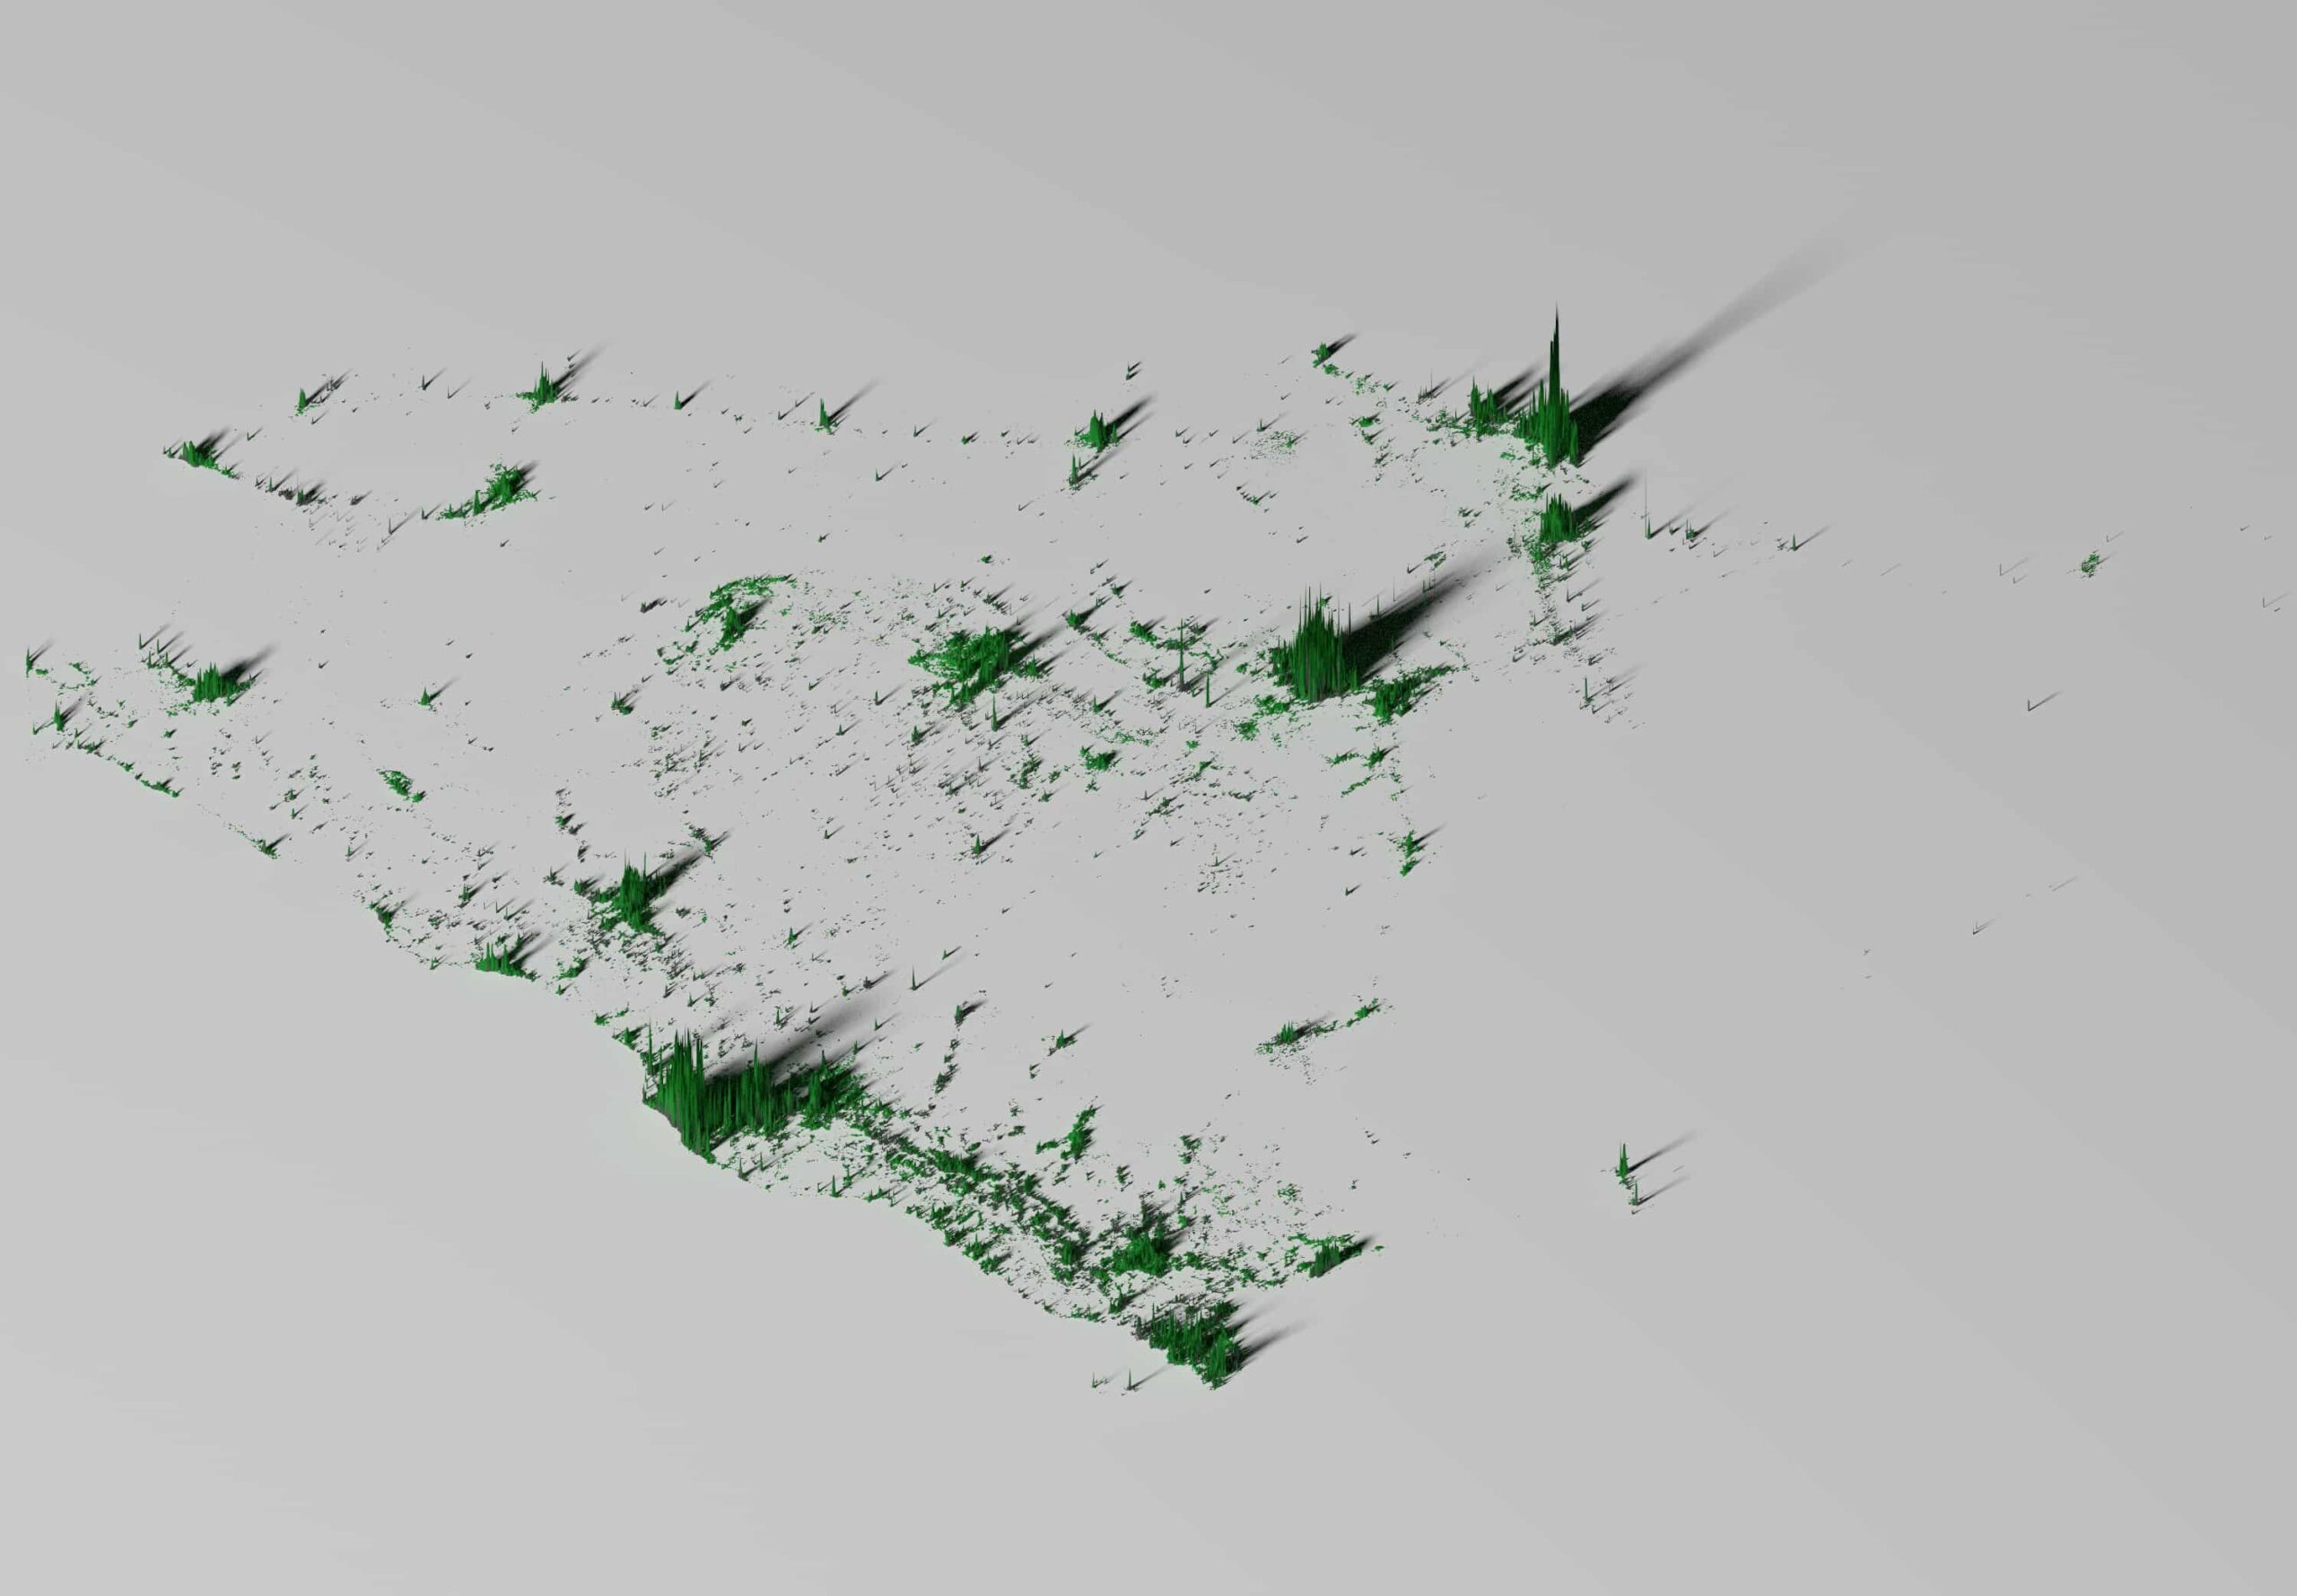
📌 Image 2:
🔹 Dataset: Kontur Population Dataset
🔹 Tools: R (RayShader Library)
Key Takeaways:
✅ Urban Hubs: Riyadh, Jeddah, and Dammam exhibit the highest population densities, reinforcing their roles as economic and industrial centers.
✅ Religious Centers: Makkah and Madinah show distinct population patterns, with Madinah having a lower population density compared to Makkah.
✅ Emerging Growth Areas: Tabuk and Jizan have notable population concentrations, indicating their increasing importance. Jizan is known for agriculture, while Tabuk, with projects like NEOM, is expected to see a rise in population density.
✅ Vast Land, Strategic Potential: While Saudi Arabia’s large landmass includes vast areas of low population density, this presents huge opportunities for industrial zones, smart cities, and mega infrastructure projects.
Saudi Arabia boasts vast land, immense potential for development, and significant economic growth opportunities. With Vision 2030 driving transformation, the future looks brighter than ever!
Wishing Saudi Arabia continued success on its journey toward Vision 2030! 🇸🇦✨