Fuhad Abdulla
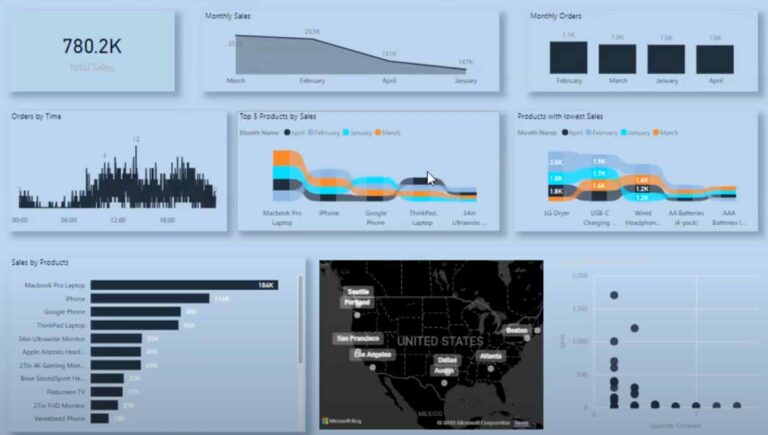
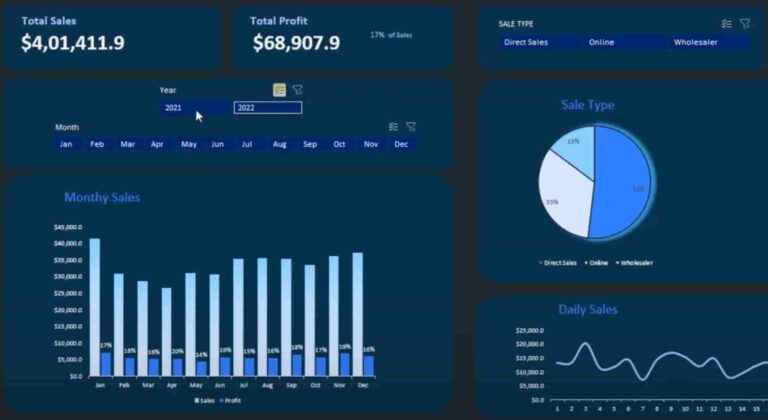
Advanced PowerBI Sales Analytics Dashboard
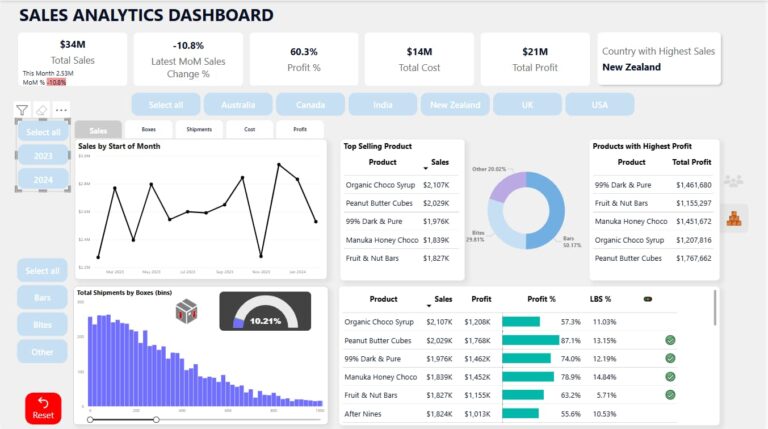
Preview Video Below Features Key Insights & Recommendations How can we apply these insights to other markets? What factors contributed to their improvement? Were they newly hired? How can we sustain their performance and motivate them further? Consider offering incentives…